Using Scripting Language to Change/Build Formulas
WinTrend provide a flexible way to change exising or embed your own formulas. You can bundle all you formulas to a dll file,
put it to the plugins subfolder, then it will be loaded automatically when main program start.
Open Formula Editor using Tools >> Formula Editor menu item. The following dialog will appear on your desktop(Figure 1).
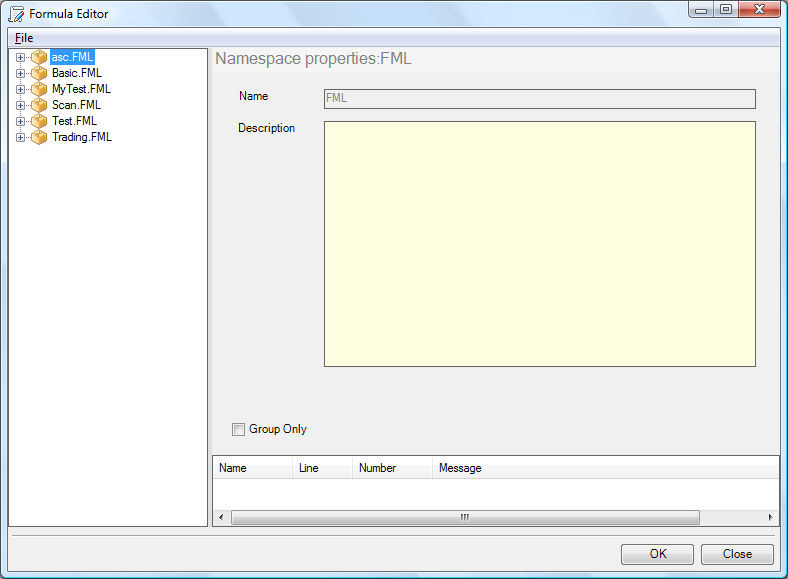 Figure 1
Expand the left tree to find the MACD formula (Figure 2).
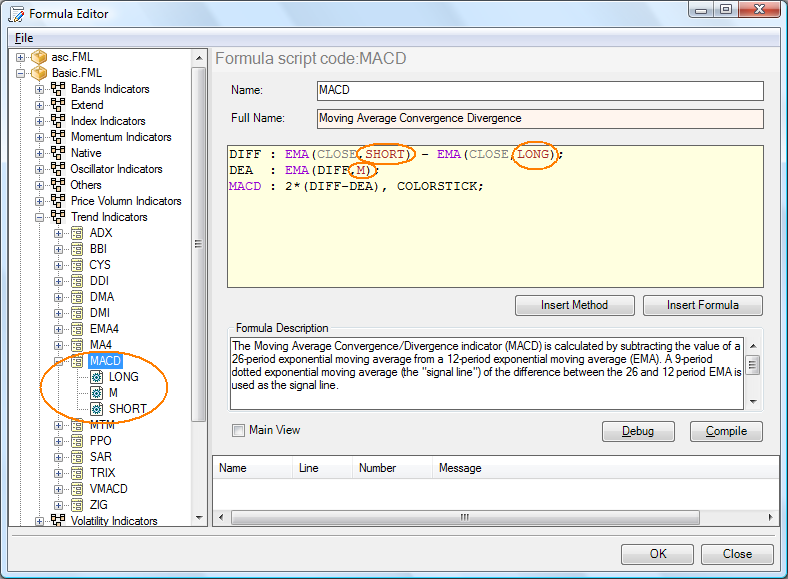 Figure 2
There are three parameters in this formula, LONG,SHORT and M. These parameters are referenced by the formula program.
In the code text box shows following formula:
DIFF : EMA(CLOSE,SHORT) - EMA(CLOSE,LONG);
DEA : EMA(DIFF,M);
MACD : 2*(DIFF-DEA), COLORSTICK;
This means the formula will show three lines on the chart : DIFF,DEA and MACD.
Let's see the first line : DIFF : EMA(CLOSE,SHORT) - EMA(CLOSE,LONG);
This line means that the exponental moving average of the last LONG days closes will be subtracted from the exponental moving average of the last SHORT days closes.
The LONG and SHORT was specified in the parameter area (Figure 3).
The second line means that the exponental moving average of the last "M" days of DIFF. DIFF is the value returned by the first line.
The third line means that first line subtract the second line, the result multiply by 2. and show this line in a style of COLORSTICK.
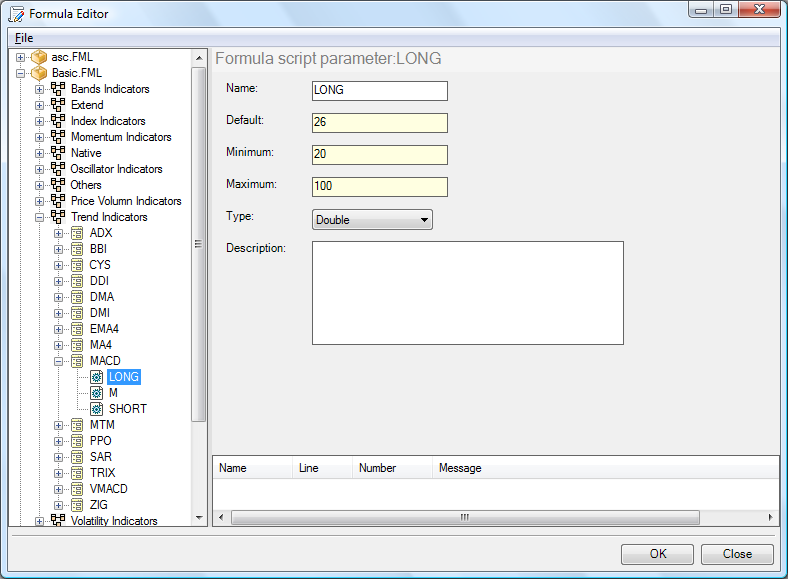 Figure 3
Close Formula Editor and add MACD formula to chart. You can see how the MACD formula is drawn in the chart (Figure 4).
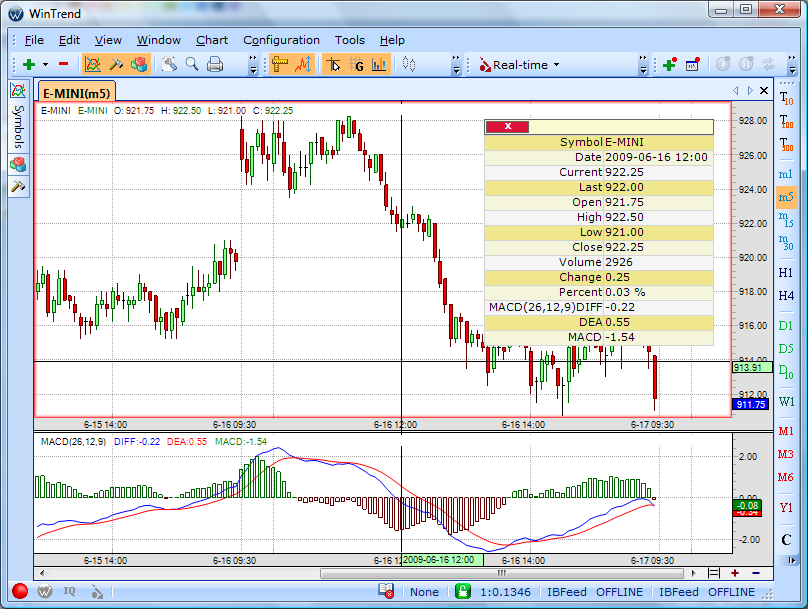 Figure 4
Let's modify the MACD formula, and see what happens.
Add two lines in the code text box:
0.25;
TRIMA:MA(DEA,M2);
Press F9 to compile it. The editor shows an error "The name M2 does not exist". This is because we did not define this parameter (Figure 5).
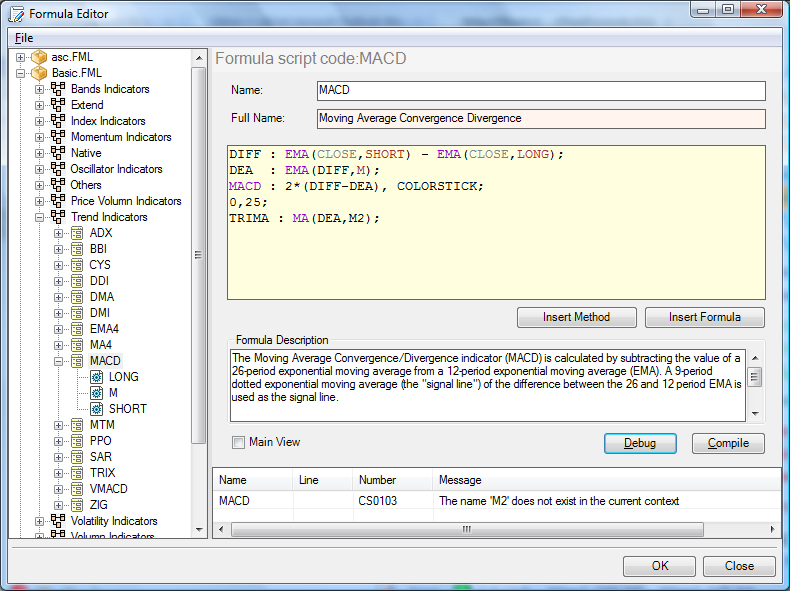 Figure 5
Right click MACD in the tree, add the parameter M2.(Figure 6-7)
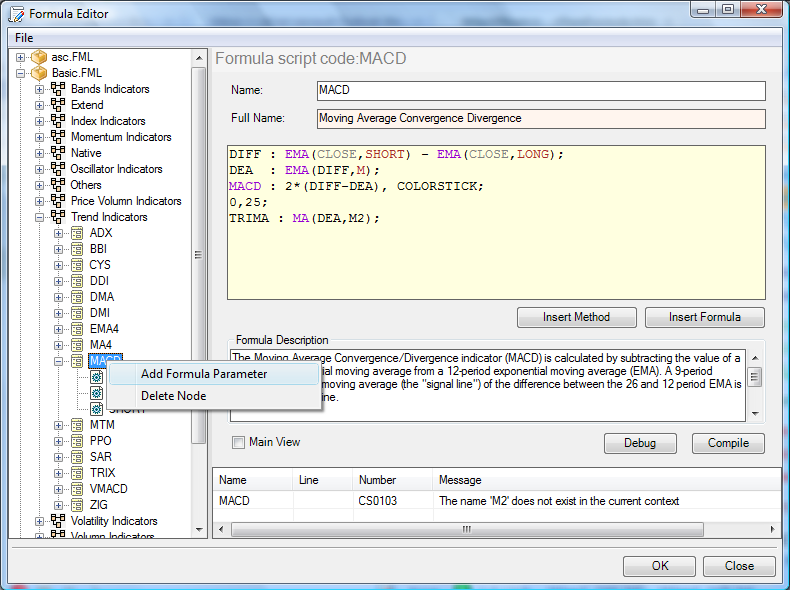 Figure 6
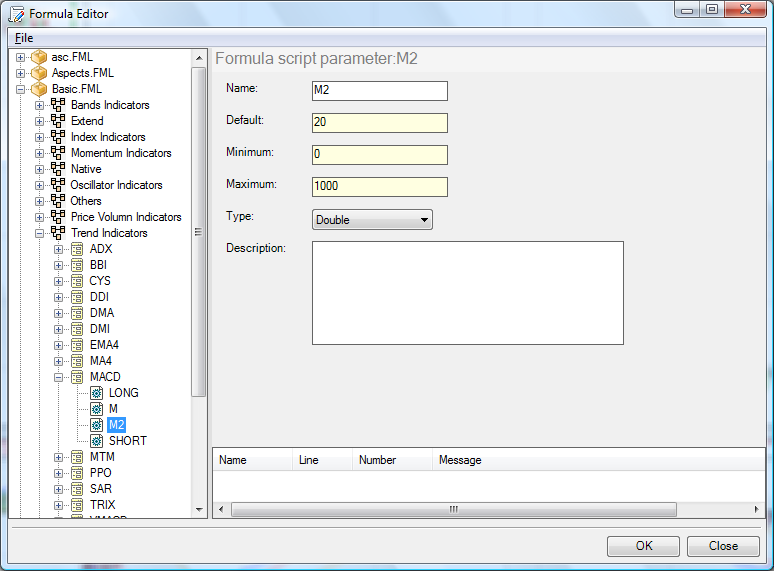 Figure 7
Press F9 to Compile.
This time we get the OK! message in the editor (Figure 8).
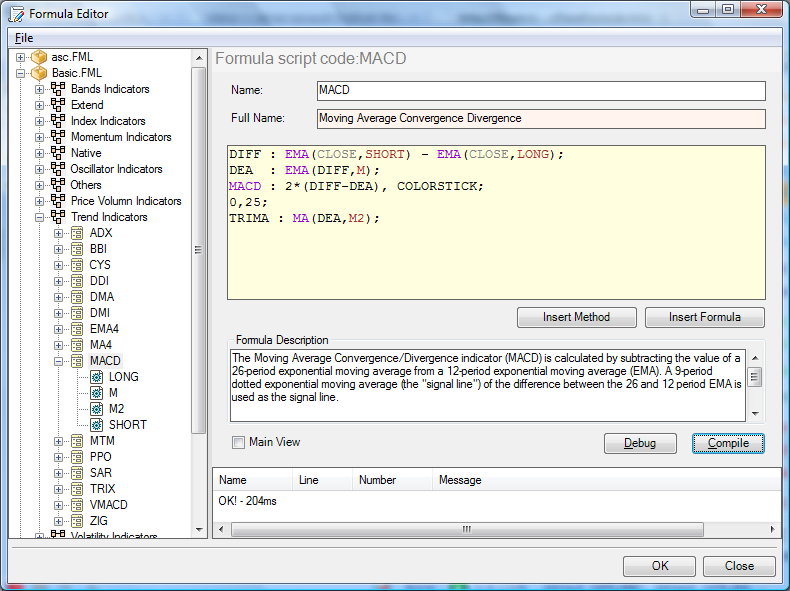 Figure 8
Close Formula Editor and confirm the changes you have made (Figure 9).
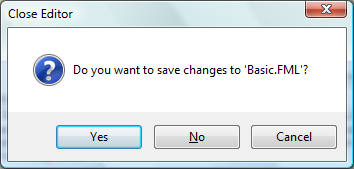 Figure 9
Let's return back to WinTrend and see what are the differences. You will see two extra lines shown in the chart (Figure 10).
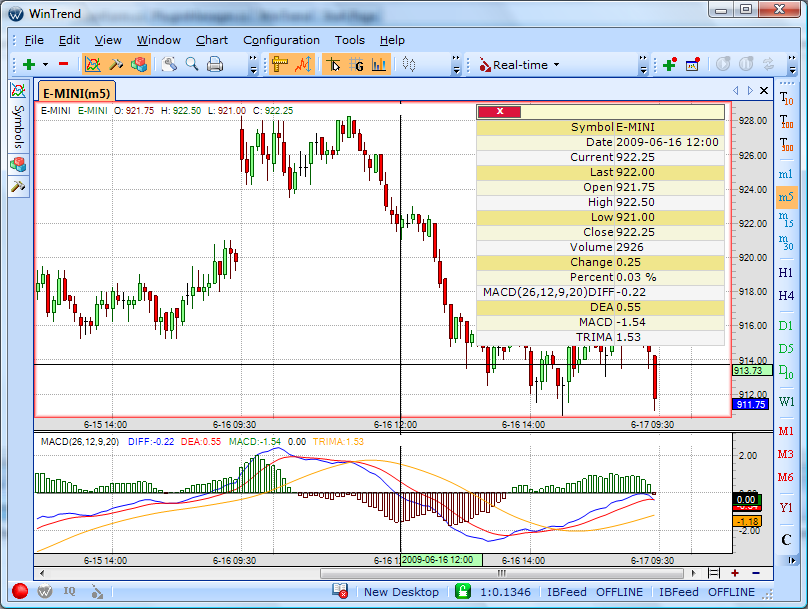 Figure 10